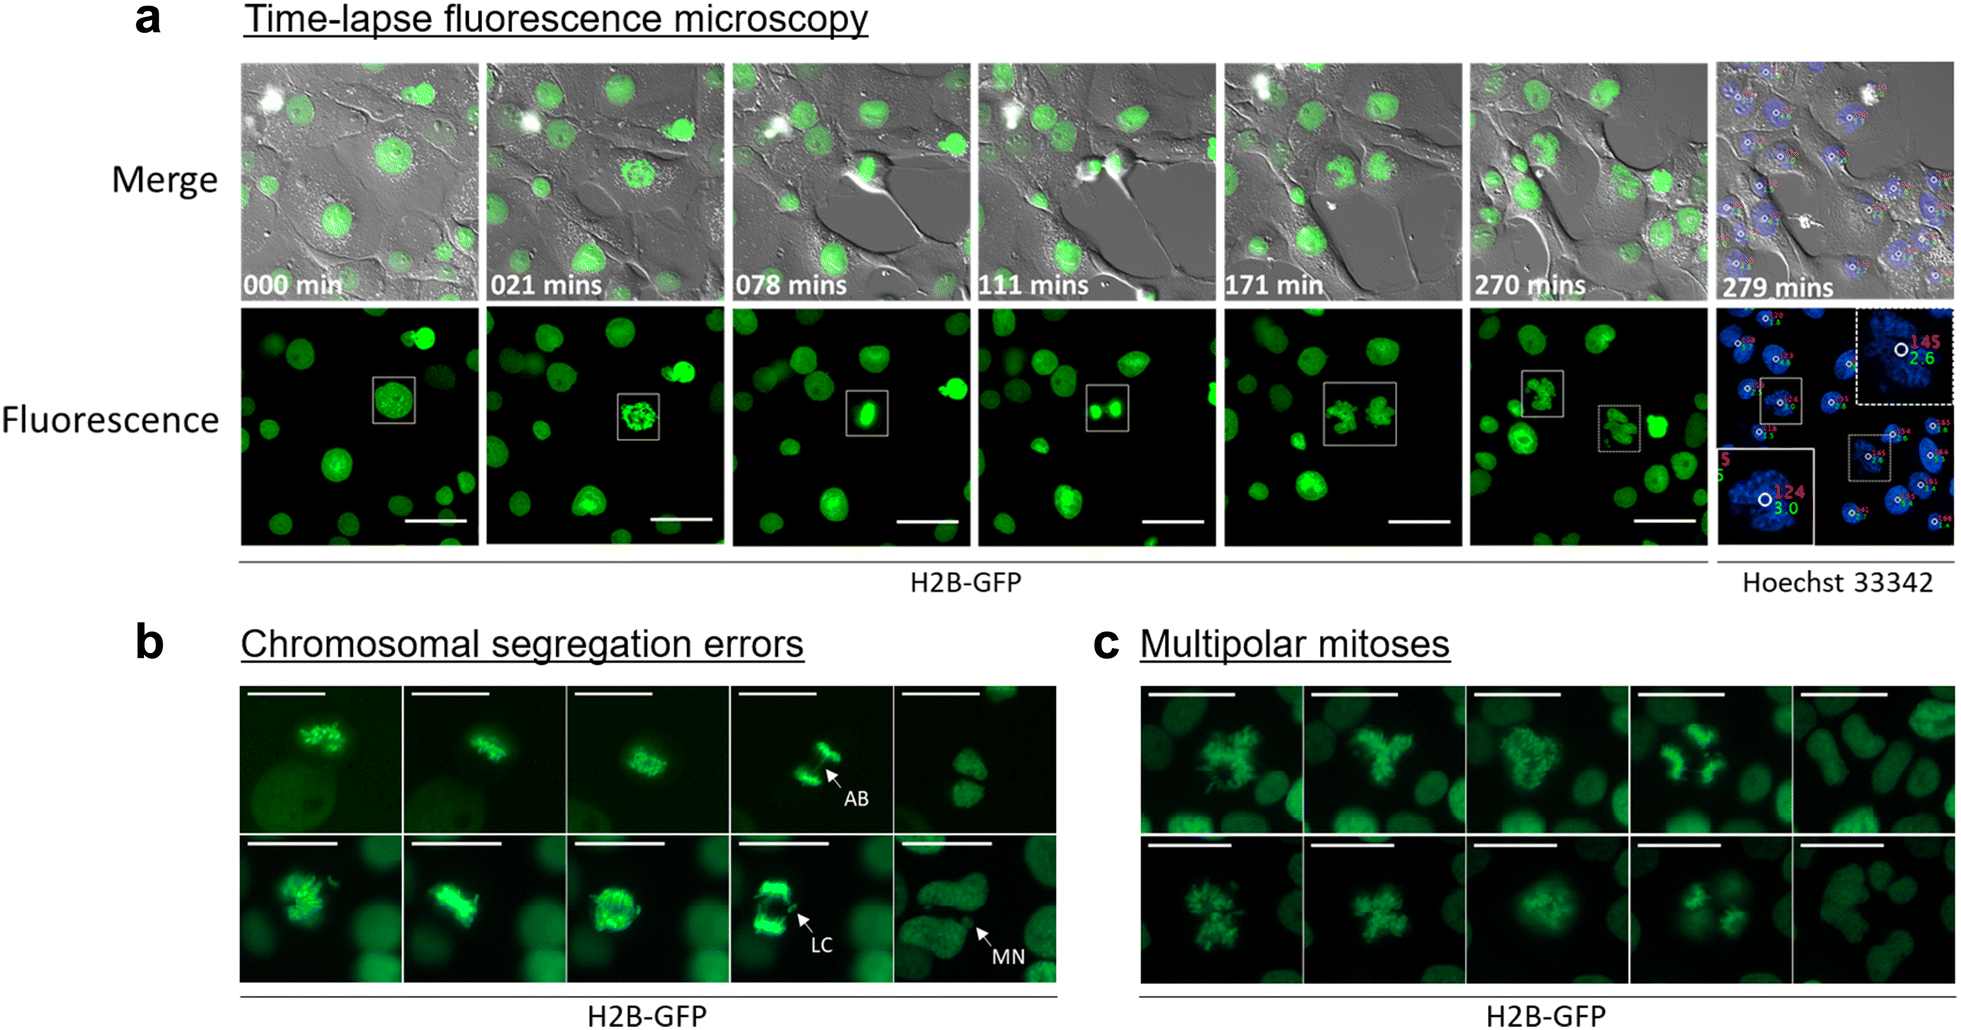
Fig. 4
From: Measuring DNA content in live cells by fluorescence microscopy

Polyploid cells occasionally experience error prone mitoses. H2B-GFP labeled cells were imaged over a 20-h time course with 3-min intervals between acquisitions. At the 18-h mark, Hoechst 33342 was added to the imaging medium. At the completion of the time-lapse experiment, images were collected for Hoechst 33342 fluorescence. Hoechst 33342 images were analyzed using the ProcessDNA pipeline and concatenated to the time-lapse series. a Highlighted is a polyploid cell progressing through mitosis with asymmetrical separation of DNA between daughter cells. Scale bar = 20 μm. b Mitotic errors such as anaphase bridges (AB, top panel) and lagging chromosomes (LC, bottom panel) with subsequent micronuclei production (MN) were observed. Scale bar = 10 μm. c Asymmetrical separation of DNA occasionally resulted from tripolar (top panel) and quadripolar (bottom panel) spindles. Scale bar = 10 μm