Fig. 9
From: Septin and Ras regulate cytokinetic abscission in detached cells

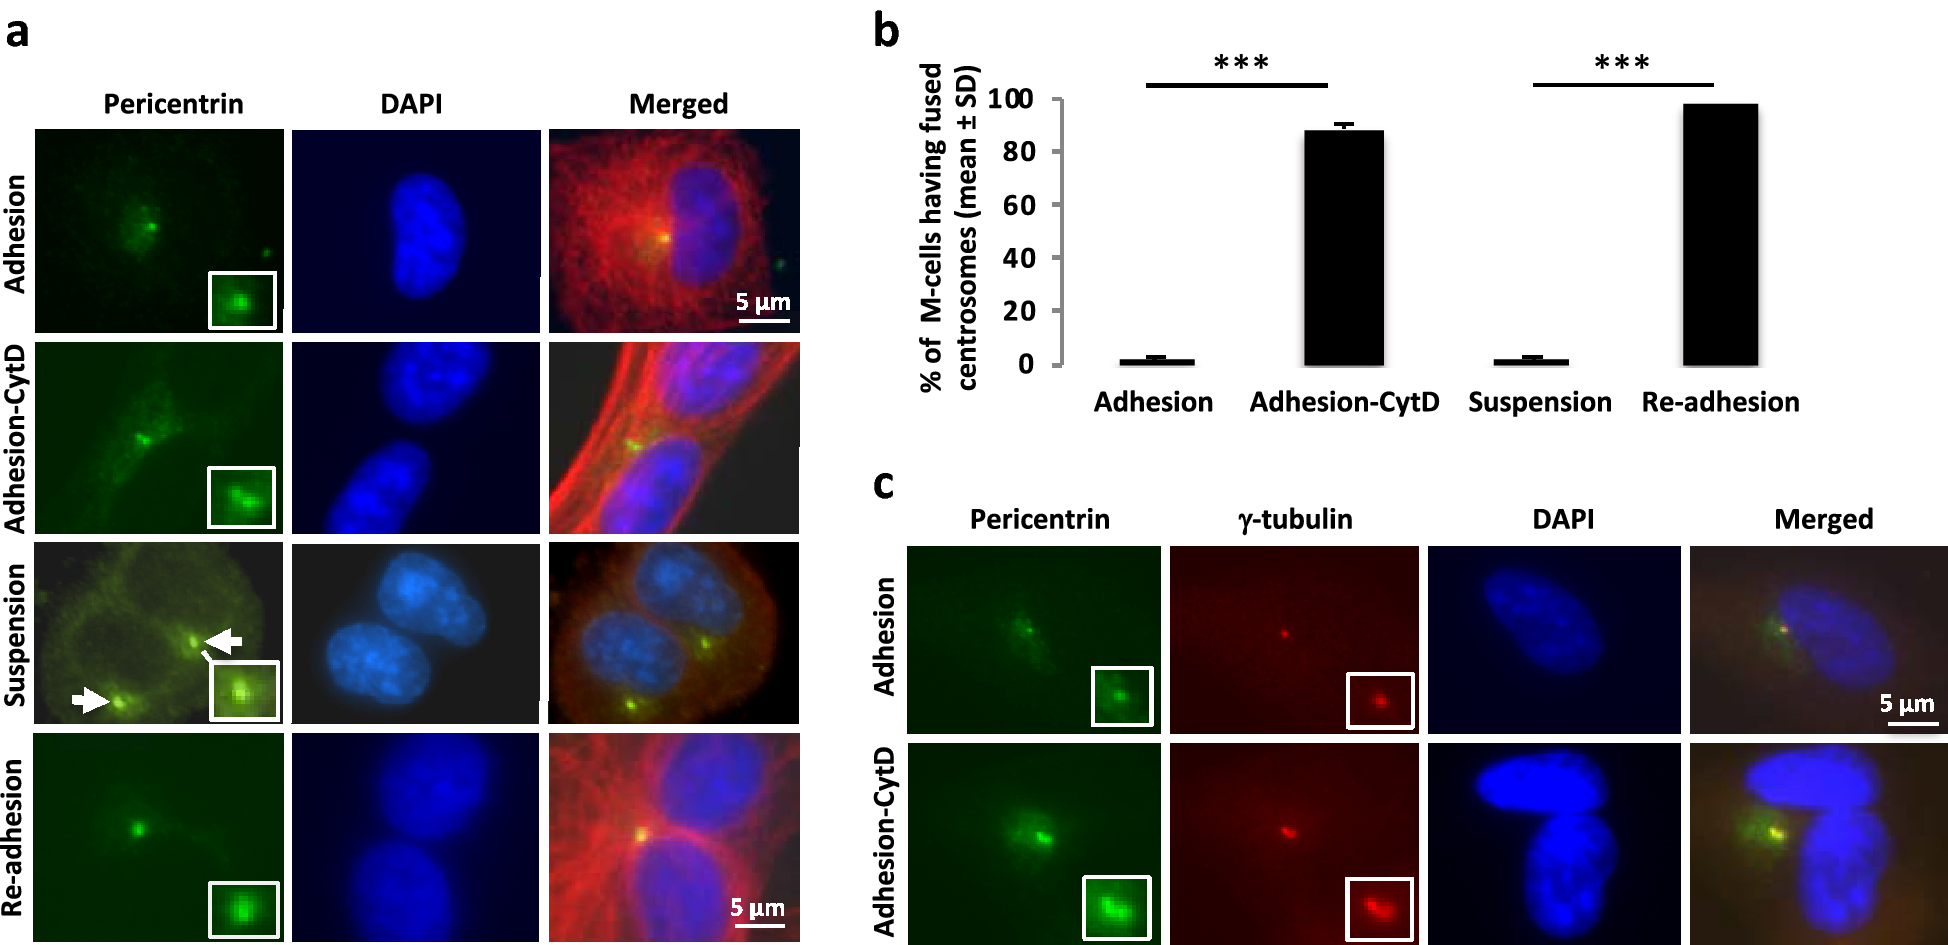
Centrosomes fuse after cleavage furrow regression. a Representative immunofluorescence images illustrating the distribution of the centrosome protein pericentrin (green) in mono- and bi-nucleated BJ cells [also labelled for α-tubulin (red) and DNA (blue)] cultured either on fibronectin-coated surface or in suspension (described in Additional file 1: Figure S1). The isolated mitotic cells were incubated on fibronectin for 1 h with or without CytD and fixed after further incubation for 2.5 h without CytD. Alternatively, binucleated cells formed by suspension culture for either 3.5 h, or 42 h followed by re-adhesion for 3 h on fibronectin, were stained as described above, and the regressed cells were analyzed. Upper row: mononucleated cell with one centrosome after completed cytokinesis; second row: binucleated regressed cell with two merged centrosomes; third row: cell with two nuclei and maintained ICB after 3.5 h in suspension having two separated centrosomes (white arrows); lower row: binucleated regressed cell after 42 h in suspension + 3 h on fibronectin with two merged centrosomes. b Mean% ± SD of the cells having fused centrosomes under the conditions described in a. Difference significance: Adhesion vs. Adhesion-CytD***, Suspension vs. Re-adhesion***. c Representative immunofluorescence micrographs illustrating co-localisation of pericentrin (green) and γ-tubulin (red) in the fused centrosomes. The square frames show the midbody region at higher magnification